
Essential Tools for Flutter Application Performance Optimization

Flutter, Google’s open-source UI software development kit, has gained immense popularity for its cross-platform capabilities and user-friendly interface. However, to ensure an application runs smoothly and meets the market’s expectations, its creators need to implement various performance optimization techniques. This article delves into the essential tools that empower Flutter developers to fine-tune their applications, enhancing speed, responsiveness, and the overall user experience.
Flutter DevTools
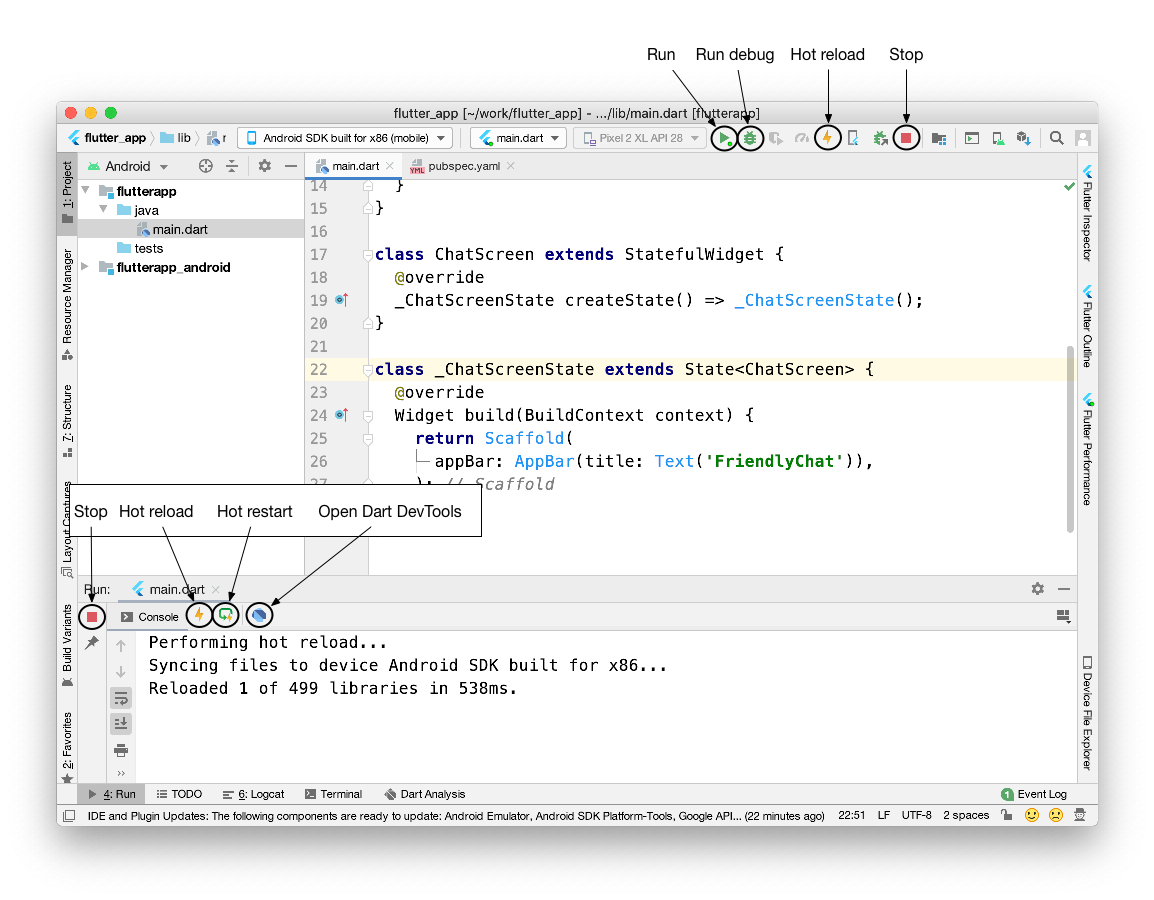
The first solution we want to describe is Flutter DevTools. It is a comprehensive suite of performance monitoring and debugging tools designed to enhance the development experience for Flutter users. It offers a visual and intuitive way to inspect and analyze the behavior of applications during work.
This toolkit equips developers with various features to optimize the development and debugging processes. DevTools includes a widget inspector, enabling creators to explore the widget tree and visualize the layout of their Flutter app. It also provides a timeline view that displays events and activities, helping developers pinpoint performance issues and bottlenecks.
One standout feature of Flutter DevTools is the hot reload capability, which allows developers to make real-time code changes and see the immediate impact on their app, saving time and streamlining the debugging process. Additionally, the memory view feature helps track and manage memory usage, ensuring efficient resource utilization.
Other features include:
- Performance overlay. It provides an on-screen overlay with real-time performance metrics, such as frames per second (FPS), to assess the app’s performance visually.
- Inspector for network traffic. DevTools can inspect and visualize network requests and responses, making it easier to diagnose network-related issues.
- Dart DevTools integration. It provides even more advanced capabilities for debugging and profiling Dart code in Flutter applications.
- App size profiling. Developers can use DevTools to analyze the size of their app’s compiled code and assets, aiding in reducing the app’s footprint and improving startup times.
- Debugging and logging. DevTools offers standard debugging features, including breakpoints, variable inspection, and log output, to help developers identify and resolve code issues.
Source: https://docs.flutter.dev/tools/hot-reload
DevTools is a valuable companion for any Flutter developer, offering a graphical and user-friendly interface for monitoring, debugging, and enhancing the performance of Flutter applications throughout the development lifecycle.
Flutter Inspector
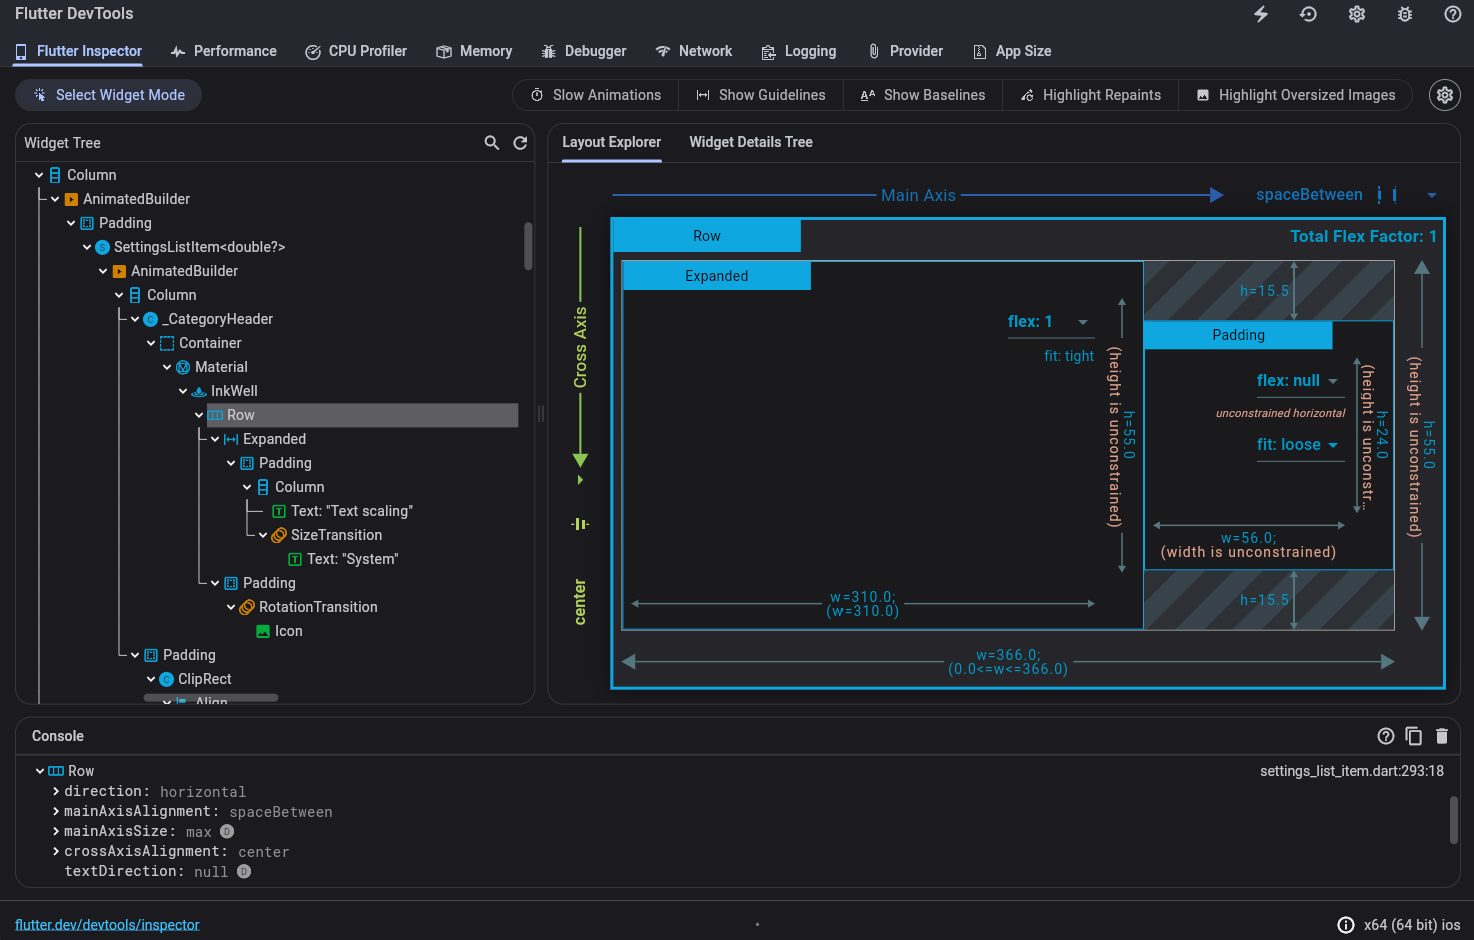
As you already know, the widget inspector is one of the core features within Flutter DevTools. It is a powerful debugging and profiling tool that is integral to the framework. It assists developers in understanding and managing the widget hierarchy of Flutter applications. By offering a visual representation of the widget tree, it provides creators with an in-depth view of how the user interface components are structured and connected within their app.
This tool allows developers to inspect individual widgets, their properties, and their relationships in a straightforward and intuitive manner. It is especially valuable for diagnosing layout and UI-related issues, making it easier to identify and resolve problems that affect the app’s appearance and behavior.
Flutter Inspector is an essential asset for developers seeking to fine-tune the user interface of their applications. Its ability to provide real-time insights into the widget tree, coupled with its interactive interface, greatly enhances the development and debugging process, ultimately leading to a more polished and responsive user experience.
Source: https://docs.flutter.dev/tools/devtools/inspector
Performance Profiling
Performance profiling tools like Android Profiler and Xcode Instruments are indispensable assets for developers striving to create high-performance mobile applications. These solutions offer a detailed look into an app’s runtime behavior, enabling creators to identify and address performance bottlenecks.
Android Profiler, a part of Android Studio, grants developers the ability to monitor various performance aspects of their apps. It encompasses CPU, memory, network, and GPU profiling, allowing for a comprehensive analysis of the app’s resource utilization. By tracking CPU usage, memory allocation, and network activity, developers can pinpoint issues that may impact app responsiveness and efficiency.
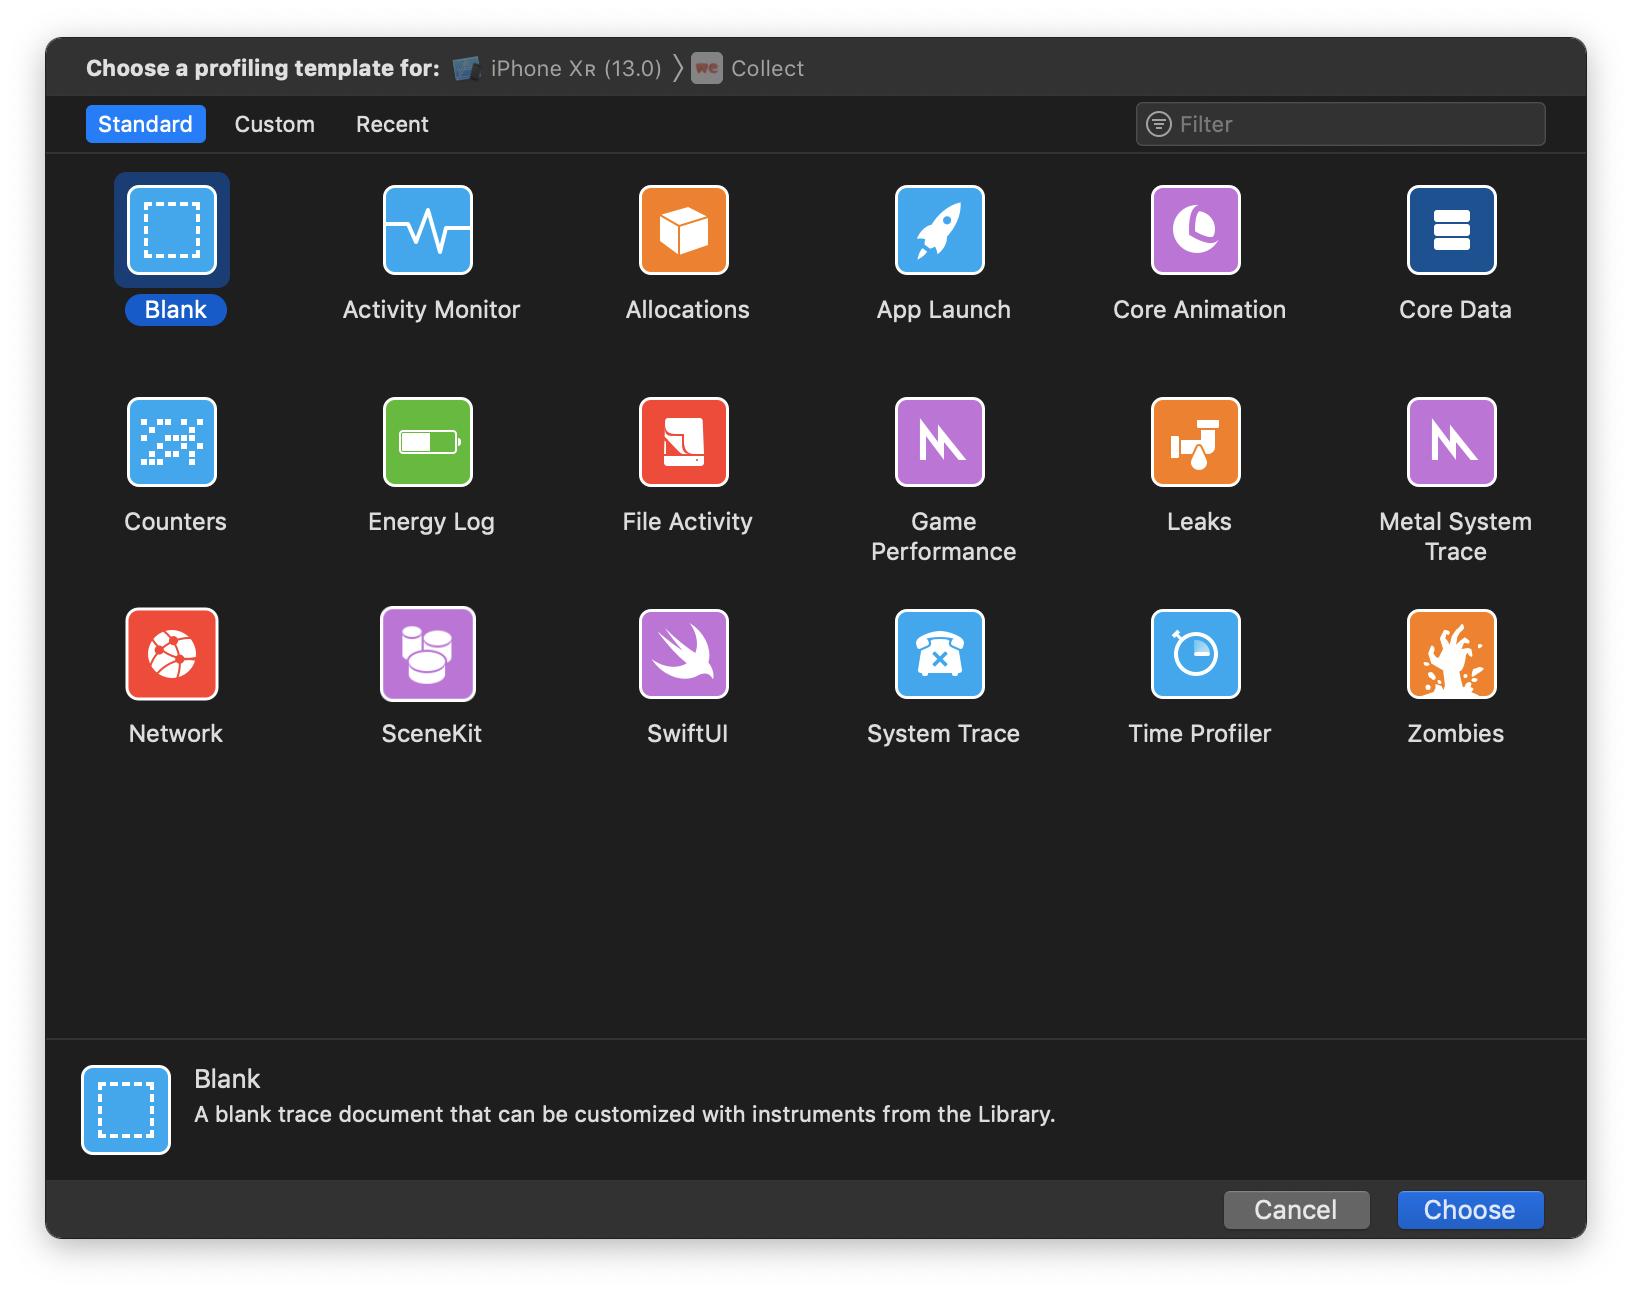
On the other hand, Xcode Instruments is tailored for iOS and macOS development. It provides an array of instruments that assist creators in diagnosing performance issues. These instruments also cover areas such as CPU usage, memory allocation, energy usage, and network activity. Developers can record and analyze app behavior over time, making it easier to detect memory leaks, excessive CPU usage, or network-related problems.
Both tools offer visual representations and timelines of performance data, simplifying the identification of anomalies or areas that require optimization. They allow developers to profile and benchmark their applications under various scenarios and conditions, ensuring consistent and efficient performance across different devices and usage patterns. They also provide deeper insights into platform-level calls and resource usage that may not be as apparent when analyzing an application solely from the Dart/Flutter level.
Source: https://www.avanderlee.com/debugging/xcode-instruments-time-profiler/
Firebase Performance Monitoring
Firebase Performance Monitoring is a robust tool that empowers developers to gain a deeper understanding of their application’s performance. Part of the Firebase suite, it offers a comprehensive view of how an app behaves in the real world.
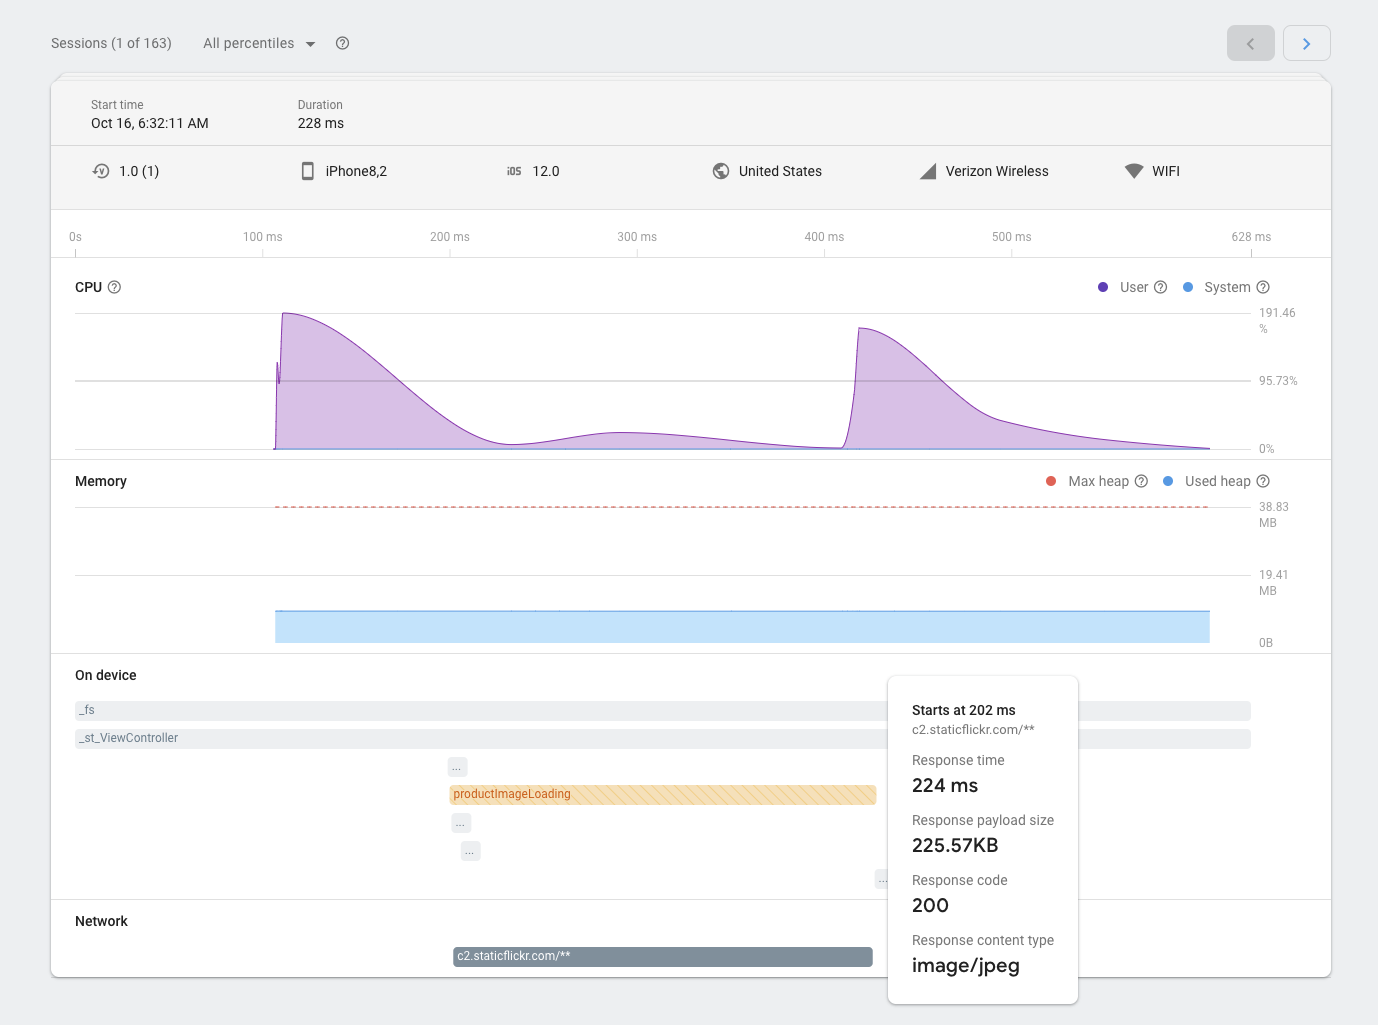
This service enables developers to set up monitoring for various aspects of their application, tracking key performance indicators (KPIs) such as startup time, network request latency, and screen rendering. By collecting and analyzing these data points, creators can identify performance bottlenecks and areas for improvement.
Firebase Performance Monitoring provides insights into specific user interactions, making it possible to pinpoint the source of any performance-related issues. Developers can visualize performance data on a timeline and view individual traces for a granular understanding of what occurs during various app sessions.
Furthermore, Firebase Performance Monitoring integrates seamlessly with other Firebase services, enabling developers to correlate performance data with specific user segments and demographics. This helps in tailoring app optimizations to meet the needs and expectations of various recipient groups.
The tool’s real-time performance monitoring capabilities offer a crucial advantage. Developers receive alerts for any performance anomalies, ensuring they can proactively address issues as they arise and deliver a more reliable and responsive app to users.
Source: https://firebase.google.com/docs/perf-mon/console?hl=pl&platform=ios
Why use tools for Flutter application performance optimization?
Investing time in understanding and utilizing performance optimization tools can significantly enhance an application’s overall performance. By actively monitoring and addressing performance issues, developers can create a smoother and more responsive user experience. This, in turn, leads to higher user satisfaction, increased retention rates, and the potential for a more successful and well-received application. Recipients are more likely to engage with and continue using an application that works well, which makes performance optimization a critical factor in an app’s success.